This is an old revision of the document!
Table of Contents
Segmentation and Analysis Options
Before you can view aggregated analyses you must define the segments and/or worksheets to be analysed.
Creating segmentation criteria
To display aggregated output, you define the worksheets to be included, either by using the defined segmentation criteria or selecting the worksheets to be included ( all worksheets is an option). To create a new aggregation, click on the new button in the toolbar to display the following dialog.
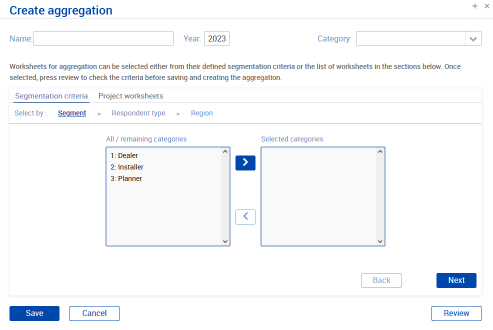 Selecting using the Segmentation criteria, allows you to select the categories you wish to select for each set of segmentation criteria and can combine options from the different sets of criteria (i.e. you could select dealers in a particular region or dealers and installers in several regions).
At each stage of the process clicking the Review button will show the current selection criteria. Click Save to generate the aggregated output and show the results.
Analysis outputs
Once you have created your first aggregation the main analysis screen will be shown with the main charts as below:
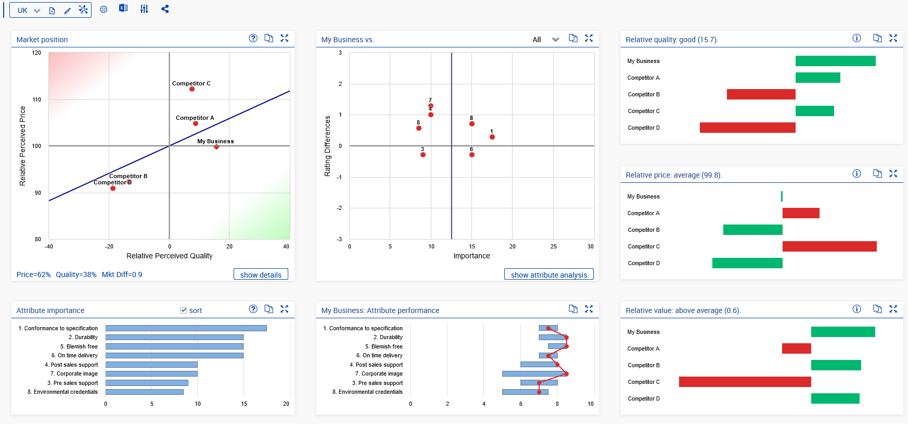
The Value Map
The Value Map shows the value proposition of all players in a market, comparing relative perceived price and relative perceived quality of the players.
 * The Fair Value Line indicates the price versus quality sensitivity of the market.
* Customer Value is the perpendicular distance to the fair value line. Competitors below and to the right are offering above average value, those above the line are offering poor value for money. * Market Differentiation is a measure of the spread of attribute scores and is defined as the average absolute difference in attribute scores between all competitors. A value below 1 indicates a relatively undifferentiated market and you would expect price to be more important than quality
Next: Interpreting the Results